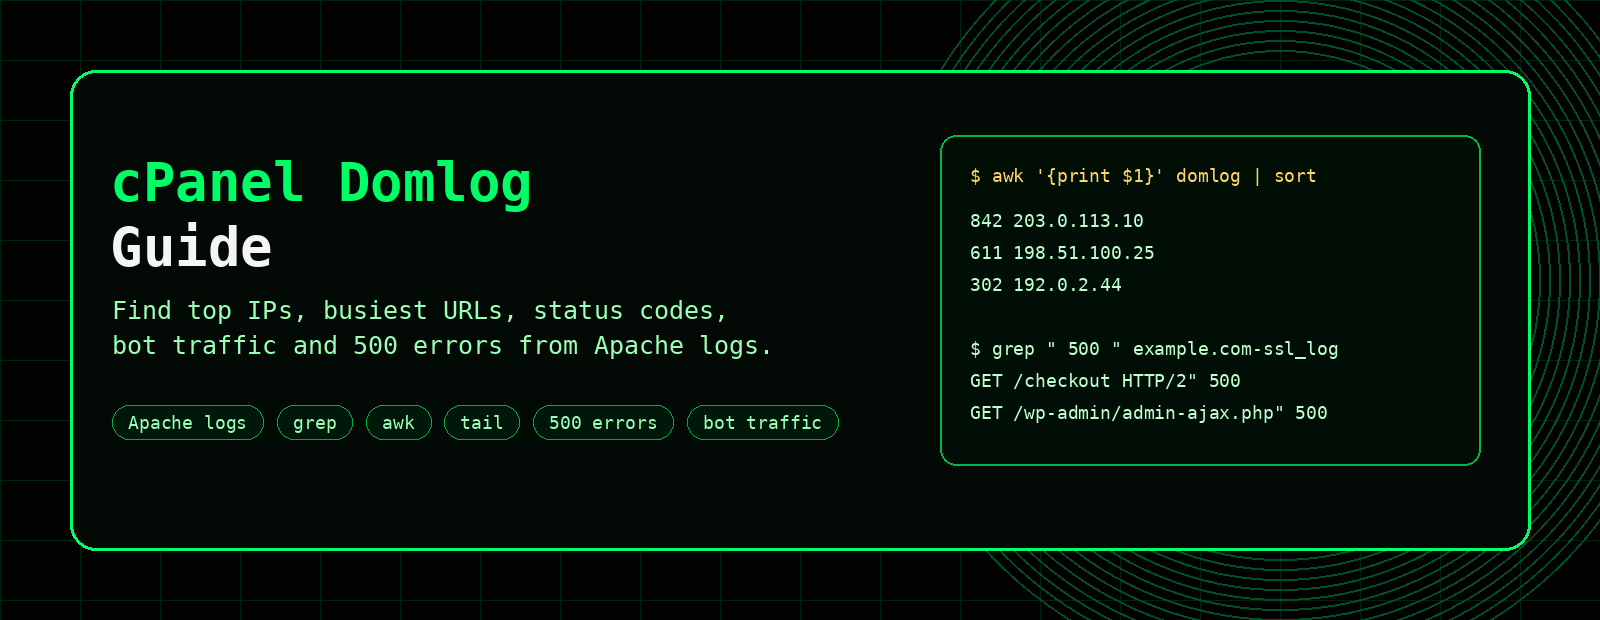
cPanel Domlog Guide
cPanel domlogs are one of the fastest ways to understand what is happening on a website. They can show traffic spikes, busy URLs, bot activity, 404 errors, 500 errors, suspicious requests and the IP addresses generating the most traffic.
This guide explains where cPanel domlogs live, how to read them, and the most useful Linux commands for analysing Apache access logs from the command line.
Where are cPanel domlogs stored?
On many cPanel servers, domain access logs are stored under:
/usr/local/apache/domlogs/Non-SSL domlog
/usr/local/apache/domlogs/example.comUsually contains plain HTTP requests.
SSL domlog
/usr/local/apache/domlogs/example.com-ssl_logUsually contains HTTPS requests. For most modern sites, check this first.
How to read a domlog line
203.0.113.10 - - [03/May/2026:10:41:22 +0100] "GET /shop/product.html HTTP/2" 200 18422 "https://example.com/" "Mozilla/5.0"| Part | Example | Meaning |
|---|---|---|
| IP address | 203.0.113.10 | The client making the request. |
| Timestamp | [03/May/2026:10:41:22 +0100] | When the request happened. |
| Request | GET /shop/product.html HTTP/2 | The method, path and HTTP version. |
| Status | 200 | The HTTP response code. |
| Bytes | 18422 | Response size in bytes. |
| User agent | Mozilla/5.0 | The browser, bot or client. |
Useful cPanel domlog commands
Watch requests live
tail -f /usr/local/apache/domlogs/example.com-ssl_logShow recent requests
tail -100 /usr/local/apache/domlogs/example.com-ssl_logFind 500 errors
grep " 500 " /usr/local/apache/domlogs/example.com-ssl_logFind 404 errors
grep " 404 " /usr/local/apache/domlogs/example.com-ssl_logFind the top IP addresses hitting a site
This is one of the most useful domlog checks when a site is slow or traffic looks high.
awk '{print $1}' /usr/local/apache/domlogs/example.com-ssl_log | sort | uniq -c | sort -nr | head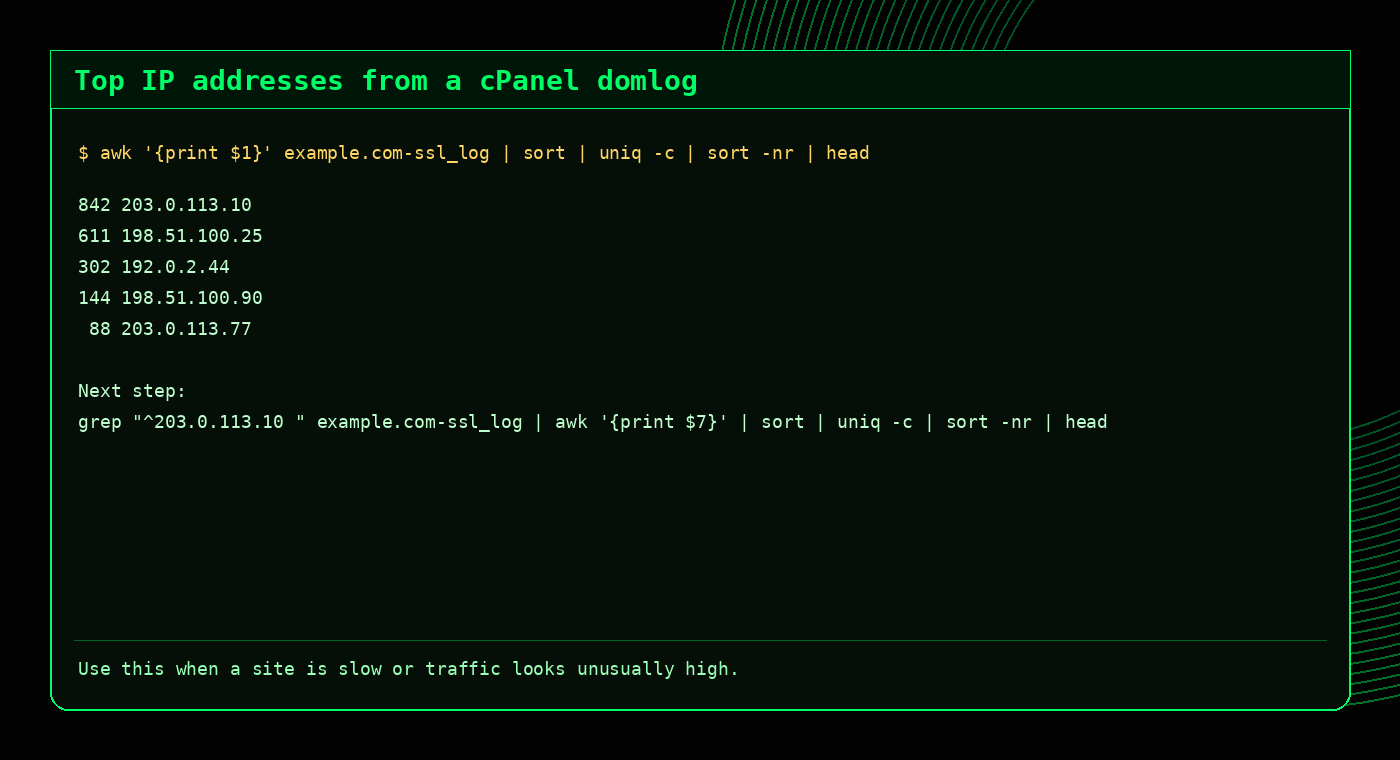
If one IP is far above the others, check what it is requesting:
grep "^203.0.113.10 " /usr/local/apache/domlogs/example.com-ssl_log | awk '{print $7}' | sort | uniq -c | sort -nr | headFind the busiest URLs
This command shows which URLs are requested most often:
awk '{print $7}' /usr/local/apache/domlogs/example.com-ssl_log | sort | uniq -c | sort -nr | headThis can reveal heavy WordPress admin traffic, repeated bot hits, expensive WooCommerce pages, missing assets, or URLs that need caching.
Tip
If admin-ajax.php appears heavily, that does not always mean abuse. Many WordPress plugins use it legitimately. Check timing, IPs, referrers and user agents.
Count HTTP status codes
This command summarises response codes:
awk '{print $9}' /usr/local/apache/domlogs/example.com-ssl_log | sort | uniq -c | sort -nr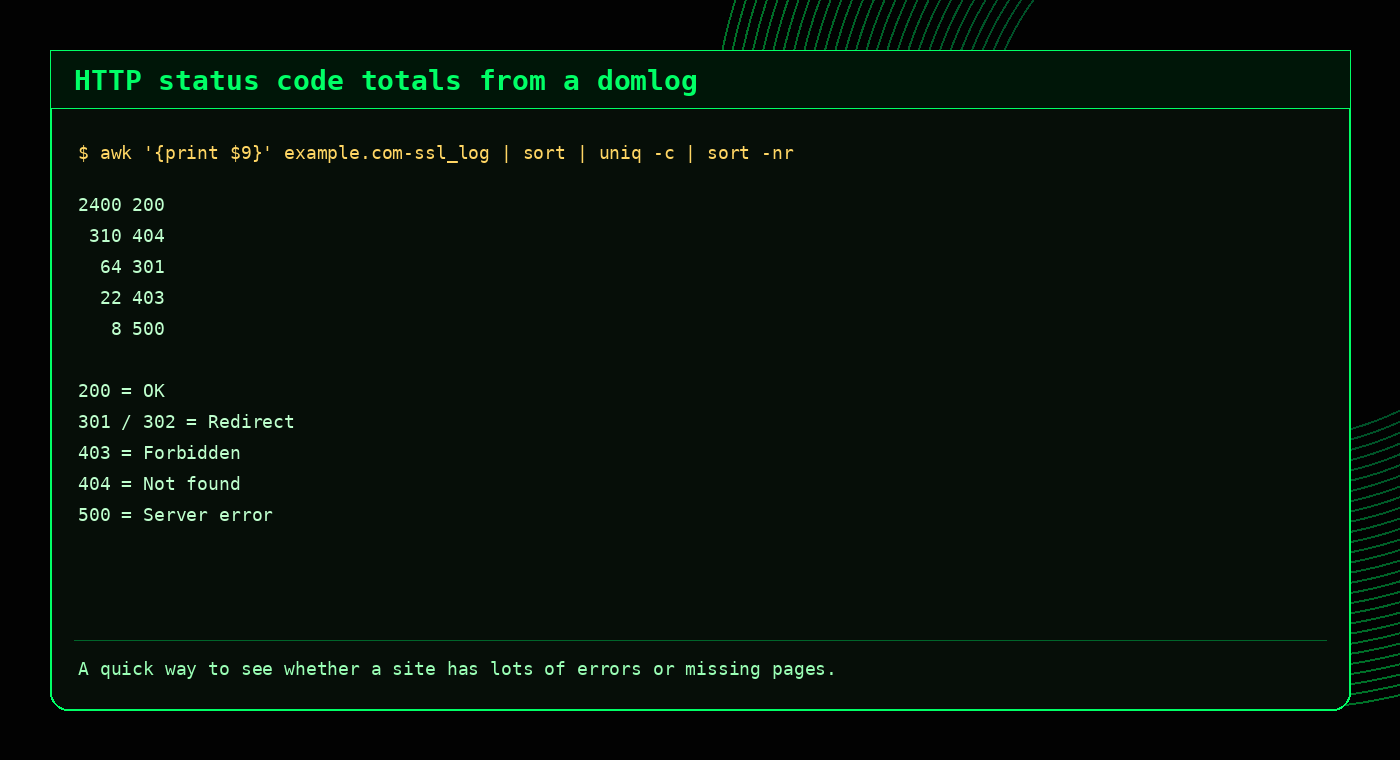
Investigate 500 errors
Domlogs can show that a 500 happened, but they do not always explain why. Start by finding the affected URLs:
grep " 500 " /usr/local/apache/domlogs/example.com-ssl_log | awk '{print $7}' | sort | uniq -c | sort -nr | head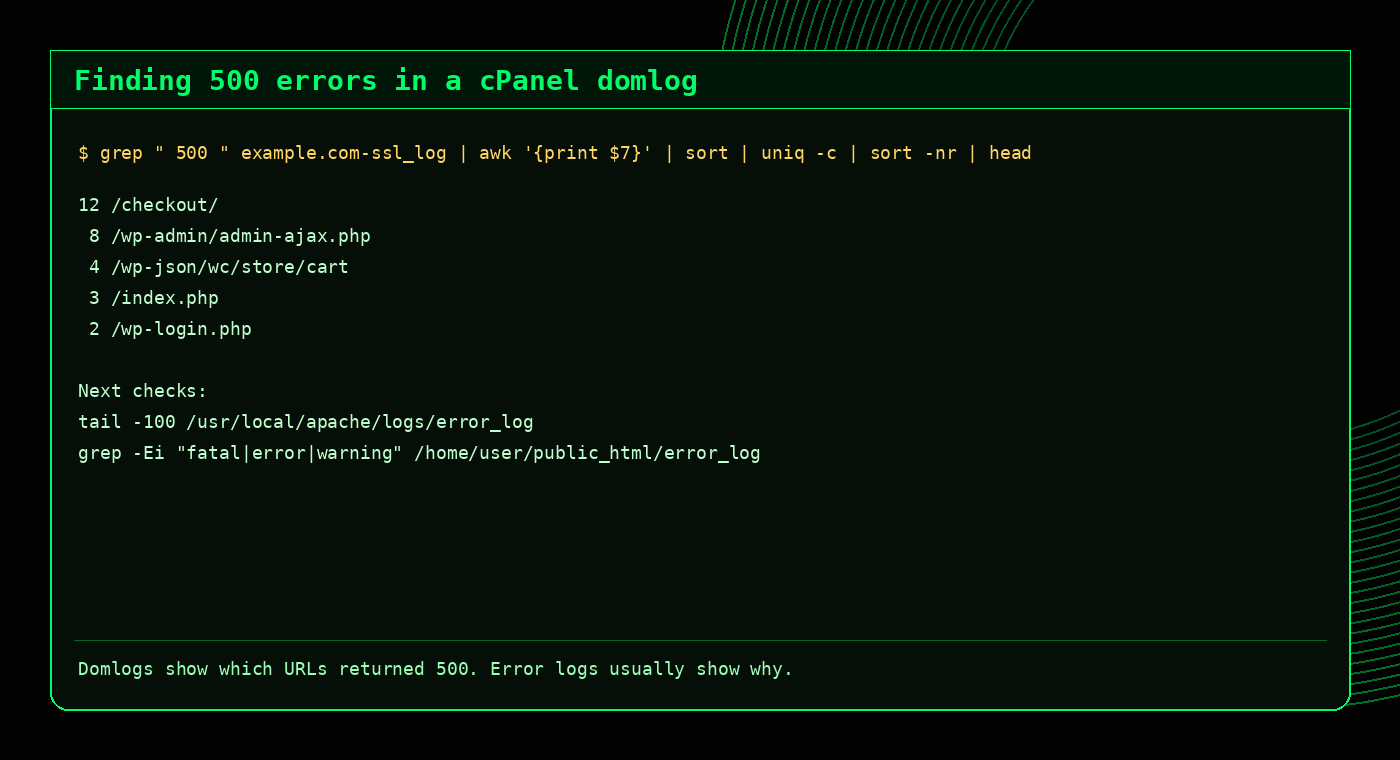
Then check recent Apache and PHP error logs:
tail -100 /usr/local/apache/logs/error_log
grep -Ei "fatal|error|warning" /home/username/public_html/error_log
Spot bot traffic in domlogs
grep -Ei "bot|crawl|spider|slurp" /usr/local/apache/domlogs/example.com-ssl_logTo count bot-like user agents:
grep -Ei "bot|crawl|spider|slurp" /usr/local/apache/domlogs/example.com-ssl_log | awk -F\" '{print $6}' | sort | uniq -c | sort -nr | headBot does not always mean bad
Googlebot, Bingbot and other legitimate crawlers may appear in logs. Look for request volume, request pattern, user agent quality and whether the traffic is causing load.
Analyse compressed or archived domlogs
Older logs may be compressed. Use zgrep to search without extracting:
zgrep " 500 " /home/username/logs/example.com-ssl_log.gz
zgrep -i "wp-login.php" /home/username/logs/example.com-ssl_log.gz
Common cPanel domlog investigation workflows
Website is slow
awk '{print $1}' domain-ssl_log | sort | uniq -c | sort -nr | head
awk '{print $7}' domain-ssl_log | sort | uniq -c | sort -nr | head
Lots of 404s
grep " 404 " domain-ssl_log | awk '{print $7}' | sort | uniq -c | sort -nr | head
grep " 404 " domain-ssl_log | awk '{print $1}' | sort | uniq -c | sort -nr | head
Possible brute force
grep "wp-login.php" domain-ssl_log | awk '{print $1}' | sort | uniq -c | sort -nr | head
grep "xmlrpc.php" domain-ssl_log | awk '{print $1}' | sort | uniq -c | sort -nr | head
Specific hour check
grep "03/May/2026:10:" domain-ssl_log | awk '{print $1}' | sort | uniq -c | sort -nr | headDomlogs vs error logs
| Log type | Best for | Example question |
|---|---|---|
| Domlog / access log | Requests, IPs, URLs, status codes, user agents | Who is hitting the site and what response are they getting? |
| Apache error log | Web server errors, rewrite issues, permission problems | Why is Apache returning an error? |
| PHP error log | PHP warnings, fatal errors, plugin/theme issues | Which script is failing? |
| MySQL/MariaDB log | Database startup, crashes, slow query investigations | Is the database causing the issue? |
FAQ
What is a cPanel domlog?
A cPanel domlog is an Apache access log for a specific domain. It records requests to the website, including IP address, requested URL, status code, referrer and user agent.
Where are cPanel domlogs located?
They are commonly found in /usr/local/apache/domlogs/. HTTPS traffic is usually logged in files ending with -ssl_log.
How do I find the top IPs in a domlog?
awk '{print $1}' /usr/local/apache/domlogs/example.com-ssl_log | sort | uniq -c | sort -nr | headHow do I find 500 errors in a cPanel domlog?
grep " 500 " /usr/local/apache/domlogs/example.com-ssl_logCan domlogs show PHP errors?
Not directly. Domlogs can show requests returning 500 errors, but PHP error logs are usually needed to see the actual PHP fatal error or warning.
Related tools and guides
External references
Useful domlog investigation commands
# Top IPs by request count
awk '{print $1}' /usr/local/apache/domlogs/example.com | sort | uniq -c | sort -nr | head

# Top requested URLs
awk '{print $7}' /usr/local/apache/domlogs/example.com | sort | uniq -c | sort -nr | head

# HTTP status code counts
awk '{print $9}' /usr/local/apache/domlogs/example.com | sort | uniq -c | sort -nr

# Top user agents
awk -F\" '{print $6}' /usr/local/apache/domlogs/example.com | sort | uniq -c | sort -nr | headFrequently Asked Questions
What is a cPanel domlog?
A domlog is an Apache access log for a domain on a cPanel server.
Where are cPanel domlogs stored?
They are commonly stored under /usr/local/apache/domlogs/ with files named after domains.
How do I find top IPs in a domlog?
Use awk to print the first field, then sort and count it with uniq -c.
Can domlogs show bot traffic?
Yes. Domlogs can show request rates, user agents, URLs and IP addresses that indicate bot activity.